![]()
One Year after February 2009
Submitted by Grunden Financial Advisory, Inc on March 12th, 2010Close to a year ago from today, the market hit a low point...but no one really knew it. The headline on USA Today, February 27, 2009 read, "Dow Posts Sixth Straight Monthly Loss, Drops 11.7% in February". The loss in February was the second-worst monthly decline the index measured...a loss of 18.4% in February 1933 is the lowest to date. The S&P didn't fare any better. Bloomberg published an article about the S&P dropping to a 12-year low at the end of February 2009. The S&P 500 declined at the steepest rate since 1937. There was not much news pointing to a recovery, let alone one a relatively quick one that would happen soon after the stark headlines above.
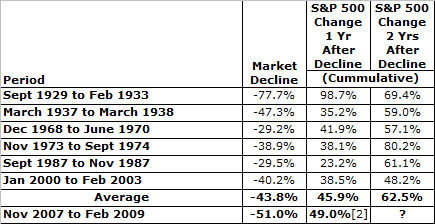
Fast forward one year since February 2009 and the S&P 500 [1] secured the second-best one year change after a major market decline. Below is a chart that illustrates declines of greater than 29% in the S&P 500 since 1926 and their subsequent one and two year performances thereafter:
Many investors, and rightfully so, were scared the market would continue to drop. There was no way to tell for sure if we had bottomed out or not and many didn't know what to do. The best thing an investor could do during this period was to review their investment/financial plan with a qualified professional. Discussing an investor's "loss tolerance" threshold in light of a plan is valid any time (even today).
We don't know what the future holds, but with one year under our belt since the February 2009 low, we know that so far the second-worst market drop has been followed by the second-best one year market gain after a major decline.